

Global Broker Regulation Inquiry App
About WikiFX
English
简体中文
繁體中文
English
Pусский
日本語
ภาษาไทย
Tiếng Việt
Bahasa Indonesia
Español
हिन्दी
Filippiiniläinen
Français
Deutsch
Português
Türkçe
한국어
العربية
اردو


How to Spot Your First Trial Short on H1 After a Break

WikiFX
|


Abstract:When an H1 uptrend stops making higher highs and then breaks below its last higher low, it signals a structural shift. This article explains how to spot that break and use it as a precise entry for a first trial short, while avoiding common beginner mistakes.

 Contents
What is the Dow Theory High-Low Transition?
In a healthy uptrend, price moves like a staircase: each peak is higher than the last (higher high) and each trough is also higher than the previous one (higher low). When price can no longer make a higher high and then falls below the most recent higher low, the uptrends structure is broken. This is a classic Dow Theory observation: the shift from rising peaks and troughs to a lower high and a lower low signals a potential trend change.
On an H1 (one‑hour) chart, this structural break happens faster than on daily charts, so traders often use it as the basis for a first trial short, a small test position that aims to catch an early turn, not a confirmed reversal.
Reading Higher Highs and Higher Lows on H1
An uptrend is defined by a sequence of at least two higher highs and two higher lows. For example:
- Price rises to a peak (HH1), then pulls back to a trough (HL1).
- Later, price rallies past HH1 to make a new peak (HH2) and then pulls back again, but this time the trough is higher than HL1 (HL2).
As long as this pattern holds, the trend is intact. The moment price makes a peak that is lower than the previous high and then breaks below the most recent higher low, the structure is no longer bullish. Many traders watch for this break on the H1 timeframe because it often precedes a more significant move lower, but it is not a guarantee.
Where to Place the First Trial Short (Step-by-Step Example)
Lets walk through a hypothetical example using EURUSD on the H1 chart. Assume the following price levels:
- The previous swing high is 1.1450.
- Price then pulls back to a higher low at 1.1380.
- Instead of rallying to a new high, price turns down from 1.1430, forming a lower high.
- Subsequently, price breaks below 1.1380 and trades at 1.1378.
Here is how a trader might pinpoint the trial entry:
- The break of 1.1380 is the trigger: the uptrends last higher low has been violated.
- A precise entry could be placed just below the break level, for example at 1.1378, to avoid false breaks by a few pips.
- This is a test entry, not a high‑conviction trade. The idea is to get positioned early in case a larger downtrend develops, but the outcome is uncertain.
A common reference for a protective stop might be above the lower high of 1.1430, but each trader decides their own risk parameters. Position size is typically kept very small because the win rate on such structural breaks is not exceptionally high.
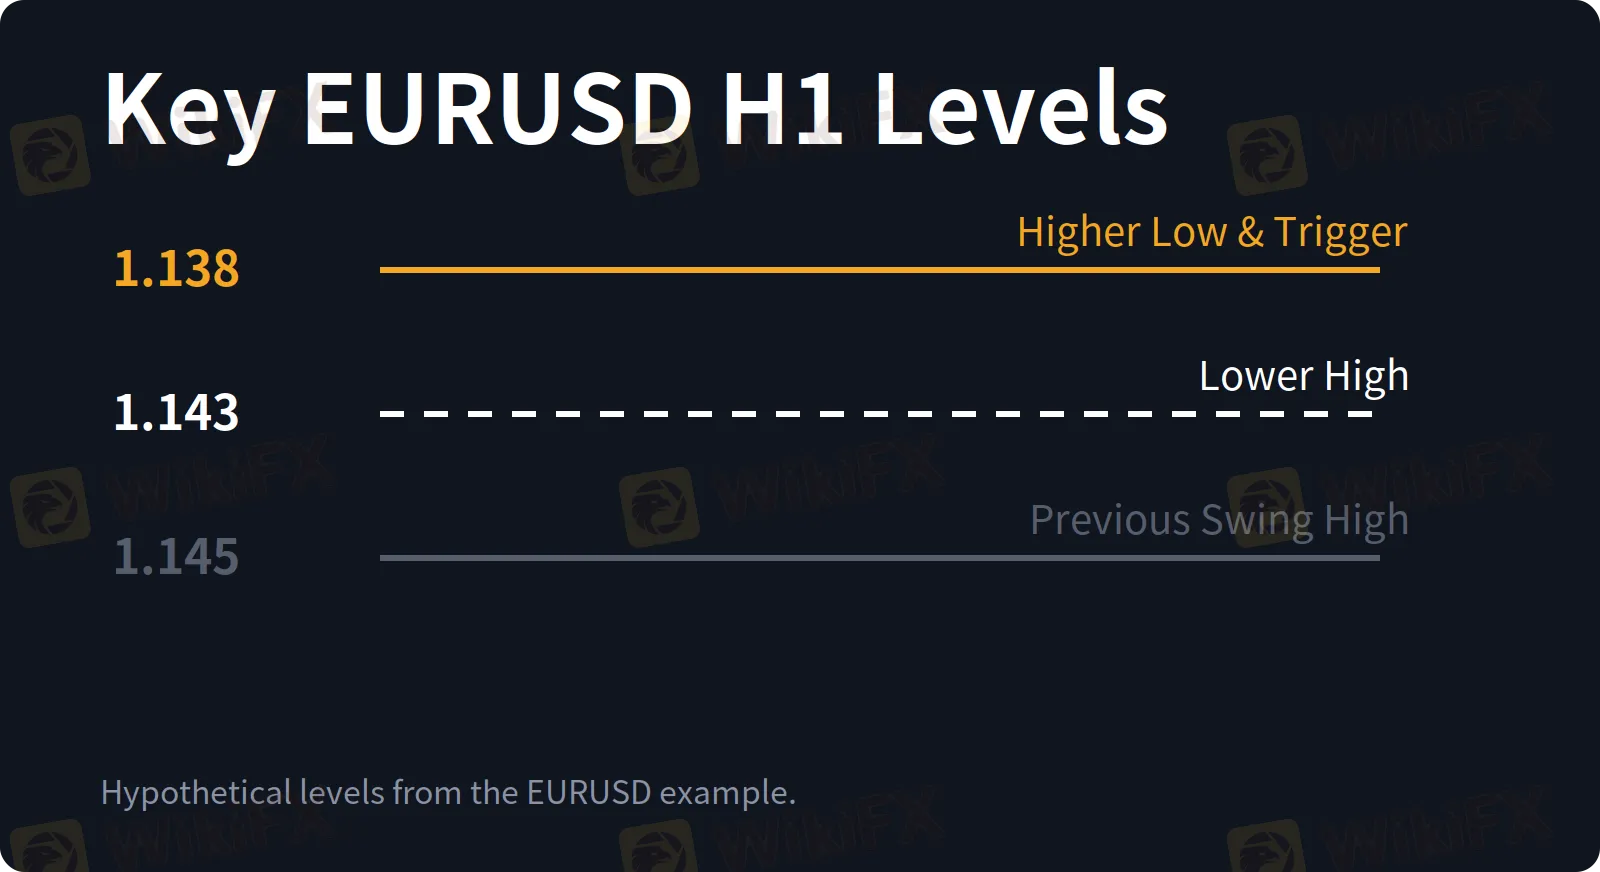
The break below 1.1380 is the trigger for a trial short.
Common Beginner Traps
- Entering before the break is confirmed: A candle that briefly dips below the higher low but closes above it may be a false signal. Many beginners jump in too early and get caught when price reverses.
- Treating every break as a major trend reversal: Most structural breaks only lead to a pullback, not a full trend change. The H1 timeframe is especially prone to noise.
- Ignoring the bigger picture: A break on H1 might be a reaction to news or a brief liquidity grab. Without checking a higher timeframe like H4, you may be trading against a much stronger trend.
- Using a full‑sized position on a trial trade: Because the expected win rate is lower for these early entries, many traders reduce risk to a fraction of their normal size. There is no single correct number, but treating a trial short like a high‑probability setup can quickly erode capital.
What It Is and What It Is Not
This Dow Theory high‑low transition is a structural observation, not a prediction. It tells you that the uptrends backbone has cracked, but it does not say how far price will fall, or even that it will fall at all. The first trial short is just a hypothesis: the trend may be changing, and a small position allows you to test that idea without committing heavily.
It is not a standalone entry system. Confirmation from volume, momentum, or a higher‑timeframe trend filter can add context, but no tool turns this into a certainty. Accepting the low win rate and managing risk accordingly is what separates a methodical test from reckless guessing.
Disclaimer:
The views in this article only represent the author's personal views, and do not constitute investment advice on this platform. This platform does not guarantee the accuracy, completeness and timeliness of the information in the article, and will not be liable for any loss caused by the use of or reliance on the information in the article.
WikiFX Broker
Latest News
Liquid Network Suffers from a US$320 Million Bitcoin Hack
WikiFXSwiss Franc weakens as US Dollar strengthens on Fed rate hike bets
WikiFXCouple Faced Over RM1.5 Million Loss After Stock Tip Scheme
WikiFXUSDCAD H4 | Bearish Rejection — Downside Targets in Focus
WikiFXBritish Pound climbs as USD fades, Hormuz risk keeps Fed in play
WikiFXOANDA Is Shutting Down MT4 Trading by 25 September 2026
WikiFXBlackwell Global UK Loss Widens as Revenue Falls 37%
WikiFXUnited States Dollar Index trades under pressure as Yen buying accelerates
WikiFXAustralian Dollar rides thin-trading lift as Fed test looms
WikiFXThai Baht: Recent THB gains face headwinds – OCBC
WikiFX