


India Q1 FY27 GDP Growth Hits 7.8%: 3 Scenarios for INR and Gold
India's Q1 FY27 GDP grew 7.8%, beating a 7.4% poll and RBI's 7.0% projection. See three conditional scenarios for INR, rates and gold.
Original

简体中文
繁體中文
English
Pусский
日本語
ภาษาไทย
Tiếng Việt
Bahasa Indonesia
Español
हिन्दी
Filippiiniläinen
Français
Deutsch
Português
Türkçe
한국어
العربية
اردو




Abstract:There are a few trading patterns that the technical trader seems to return to time and time again. The "head and shoulders pattern" is without a doubt one of the most popular. In fact, some traders would exclusively trade this pattern, but there are a few factors to take in mind before using it, as with everything else.
There are a few trading patterns that the technical trader seems to return to time and time again. The “head and shoulders pattern” is without a doubt one of the most popular. In fact, some traders would exclusively trade this pattern, but there are a few factors to take in mind before using it, as with everything else.
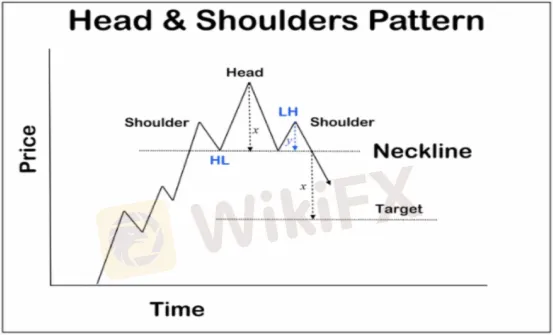
Defining the pattern is the first step.
The first step is to figure out what pattern we're dealing with. The left shoulder, the head, and the right shoulder are the three sections of the head and shoulders pattern. It's a pattern in which a high arises, then a retreat, a higher high, and finally a low or high. In other words, the right shoulder, the third section of the pattern, is a lower height from the head.
It is not necessary for all head and shoulders patterns to be negative.
There is an inverse pattern, as is the case with many technical patterns. This is essentially a sequence of three lows, beginning with a rebound back to the upside on the left hand shoulder, then a break down to create the head, a bounce back to the upside, and finally a “higher low” producing the third shoulder. It's a “upside down head and shoulders design,” to put it simply. This indicates that the selling are losing steam, and the market might be poised for a strong rally. Take a look at the graph below to understand how this works in reverse. It should be obvious that it is the exact same thing, only inverted.
Head and shoulders patterns don't have to be negative all of the time.
An inverse pattern exists, as it does with many technical patterns. This is merely a sequence of three lows, beginning with a rebound back to the upside on the left hand shoulder, then a break down to create the head, a bounce back to the upside, and finally a “higher low” producing the third shoulder. It's a “inverted head and shoulders pattern,” to put it simply. This indicates that the sellers' impetus is fading, and the market may be poised for a strong rally. See how this works in an inverted pattern in the graphic below. It's the same thing, but inverted.
Remember, if you require other people to go along with you, simplicity is one of the features of a strong trading method. These clear patterns are beneficial since the rest of the market can be pushed in the same direction as you.

Disclaimer:
The views in this article only represent the author's personal views, and do not constitute investment advice on this platform. This platform does not guarantee the accuracy, completeness and timeliness of the information in the article, and will not be liable for any loss caused by the use of or reliance on the information in the article.
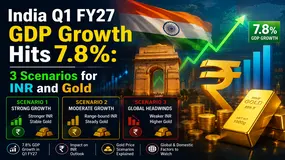
India's Q1 FY27 GDP grew 7.8%, beating a 7.4% poll and RBI's 7.0% projection. See three conditional scenarios for INR, rates and gold.

Choosing a forex liquidity provider is not a search for the lowest displayed spread or the longest provider list. It is a broker decision about pricing integrity, depth, routing, credit, reporting, incident response, and client communication. This 2026 guide explains how a forex LP, FX liquidity provider, or liquidity provider forex arrangement fits into a broker’s execution chain; what to test before onboarding; why a “best forex liquidity provider” claim cannot replace due diligence; and how to compare cost beyond commission. Use the execution-quality scorecard, provider questions, routing scenarios, and 90-day onboarding plan to assess whether a liquidity relationship can support your actual client mix, instruments, risk model, and jurisdiction. The goal is not to make a universal ranking. It is to build evidence that your broker can explain, supervise, reconcile, and recover its execution service when market conditions are difficult.
The visible fee in an MT4 white label proposal is rarely the real cost of operating it. For an existing broker, the decision is not simply whether an MT4 white label platform is “cheap” or “expensive.” The real question is whether the commercial model remains viable after integration, support, data, client migration, compliance, and exit costs are included. That is why an MT4 white label cost review should be built as a 24- to 36-month operating case. It should compare three credible choices: 1. Keep the present MT4 setup and improve its weakest controls. 2. Replace the MT4 white label provider but retain the client proposition. 3. Migrate selected clients or products to another platform while running MT4 in parallel. This guide explains how to build that case without relying on headline prices or generic vendor claims.

Withdrawal delays are precisely the complaint we keep receiving on WikIFX, a veteran in the forex regulation inquiry space. While some users receive withdrawal access initially and find rejections on their applications later, some fail to receive a single approval. Some delays usually result from genuine compliance requirements that brokers need to adhere to. However, in many cases, traders have accused the broker of repeated excuses as part of its alleged strategy to deny a seamless fund release. A pending withdrawal cannot be an outright indicator of fraudulent activity. Financial institutions, including forex brokerage entities, need to abide by the anti-money laundering (AML) and Know Your Customer (KYC) regulations. However, as the monitoring process stretches beyond weeks or months, traders become frustrated and raise questions over the broker’s reliability.
WikiFXWikiFXWikiFXWikiFXWikiFXWikiFXWikiFXWikiFXWikiFXWikiFX