

Global Broker Regulation Inquiry App
About WikiFX
English
简体中文
繁體中文
English
Pусский
日本語
ภาษาไทย
Tiếng Việt
Bahasa Indonesia
Español
हिन्दी
Filippiiniläinen
Français
Deutsch
Português
Türkçe
한국어
العربية
اردو
FPG USTEC Market Report July 21, 2026
Abstract:On the H1 timeframe, USTEC (Nasdaq-100) previously experienced a sustained and consistent decline from 29,597 to 28,213 before finding support and recovering within an ascending channel. The index is
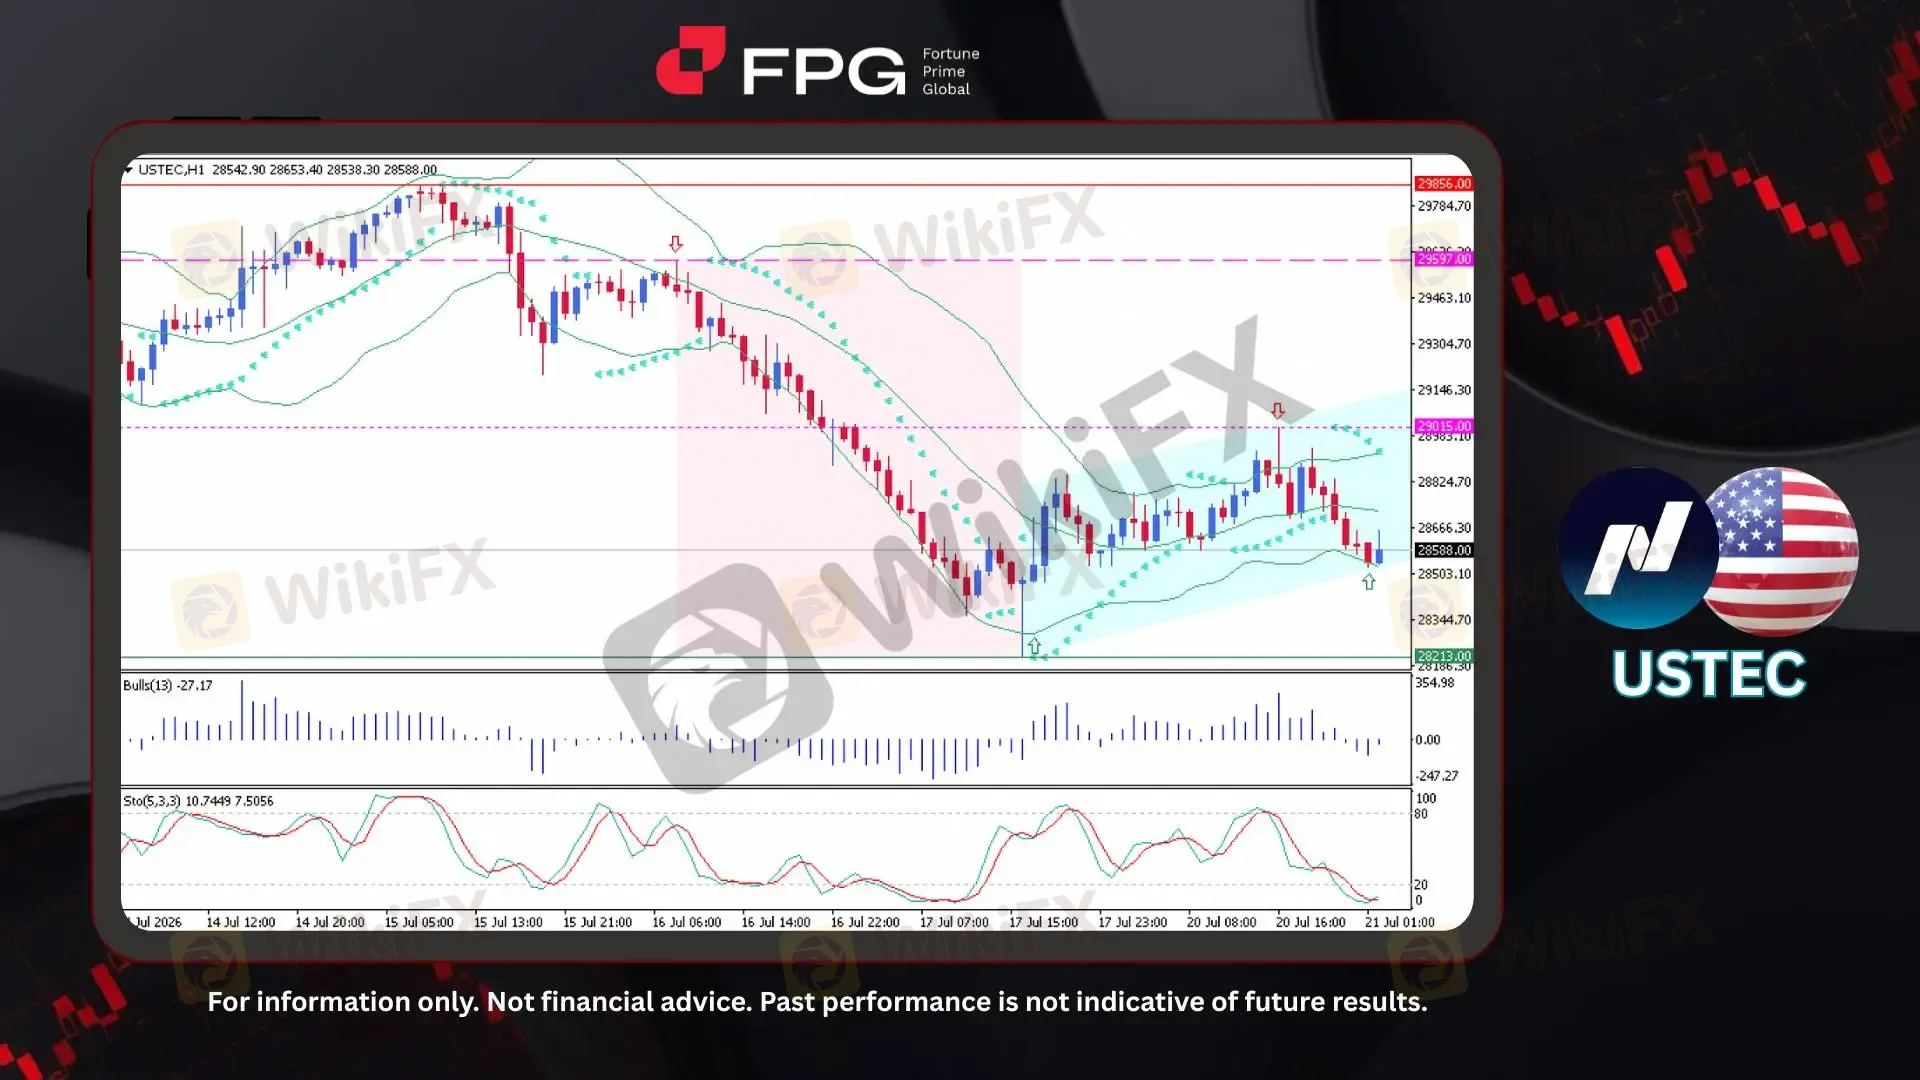
On the H1 timeframe, USTEC (Nasdaq-100) previously experienced a sustained and consistent decline from 29,597 to 28,213 before finding support and recovering within an ascending channel. The index is currently trading around 28,588, with volatility gradually increasing as price tests the lower boundary of the channel, suggesting that buyers are attempting to defend the prevailing recovery structure. The nearest resistance is located at 29,015, while the closest support remains at 28,213. A sustained break above resistance could strengthen the bullish recovery, whereas a move below support would increase the risk of renewed selling pressure.
From a technical perspective, the Bollinger Bands remain relatively stable with a slight expansion, indicating that volatility is gradually increasing without signaling a decisive breakout. The Parabolic SAR dots continue to print above the candlesticks, reflecting that short-term bearish pressure is still present despite the broader recovery trend. Meanwhile, Bulls Power has weakened and returned to negative territory, suggesting that buying momentum has softened over recent sessions. However, the Stochastic Oscillator is deeply oversold and beginning to flatten, indicating that bearish momentum may be fading and that the index could be positioned for a technical rebound if buying interest strengthens.
Recent market sentiment toward the Nasdaq 100 has improved as optimism surrounding upcoming technology earnings, continued investment in artificial intelligence, and resilient semiconductor demand outweigh concerns over inflation and geopolitical risks. Investors remain focused on second-quarter earnings results and forward guidance from major technology companies, which are expected to shape the index's near-term direction. Although the Federal Reserve continues to maintain a cautious monetary policy stance, resilient corporate earnings expectations continue to underpin demand for growth-oriented stocks. These supportive fundamental developments reinforce the broader view that USTEC is undergoing a constructive bullish recovery following its previous sustained decline, even as short-term technical indicators point to a temporary corrective phase within the broader upward structure.
Technical Market Overview
1. Current Position: USTEC is currently trading near 28,588 after rebounding from 28,213, with price continuing to move within an ascending channel on the H1 timeframe. However, the recent pullback toward the channel's lower boundary suggests that short-term bearish pressure remains, while buyers continue attempting to defend the broader recovery structure.
2. Resistance Zone: The nearest resistance is located at 29,015. A sustained breakout above this level would confirm renewed bullish momentum and increase the likelihood of an extension toward higher resistance levels.
3. Support Zone: The closest support is found at 28,213, which aligns with the base of the recent recovery. Holding above this level would preserve the current bullish structure, whereas a decisive break below it could trigger a deeper corrective decline.
4. Indicator Observation: The Bollinger Bands remain relatively stable with a slight expansion, reflecting gradually increasing volatility. The Parabolic SAR continues to plot above the candlesticks, indicating that short-term bearish pressure remains intact. Bulls Power has slipped back into negative territory, suggesting weakening buying momentum, while the Stochastic Oscillator is deeply oversold and beginning to stabilize, signaling that selling momentum may be fading and a technical rebound could develop.
5. Technical Summary: Although USTEC is undergoing a short-term pullback, the broader recovery structure remains intact as long as price stays above the 28,213 support level. Improving market sentiment, supported by optimism over technology earnings and AI-driven growth, continues to favor the medium-term bullish outlook. Nevertheless, traders should monitor price action near the lower channel boundary, as confirmation of renewed buying momentum will be needed before expecting another advance toward the 29,015 resistance level.
Market Performance:
Indices Last Price % Change
US500 7,440 −0.05%
US30 51,848 −0.04%
Key Economic Calendar:
UK: Average Earnings incl. Bonus (3Mo/Yr)
UK: Employment Change
UK: Unemployment Rate
EU: ZEW Economic Sentiment Index
DE: ZEW Economic Sentiment Index
US: ADP Employment Change Weekly
Risk Disclaimer: This report is for informational purposes only and does not constitute financial advice. Investments involve risks, and past performance does not guarantee future results. Consult your financial advisor for personalized investment strategies.
Disclaimer:
The views in this article only represent the author's personal views, and do not constitute investment advice on this platform. This platform does not guarantee the accuracy, completeness and timeliness of the information in the article, and will not be liable for any loss caused by the use of or reliance on the information in the article.
WikiFX Broker
Latest News
Malaysia’s Pension Fund (KWAP) Hit by eFishery Fraud Scandal with RM163 Million at Risk
 WikiFX
EMAR MARKETS Review 2026: FSCA Regulation, Withdrawal Complaints, and Account Access Risks
WikiFXFacing a 20% Floating Loss: How Beginners Can Prevent a Margin Call
WikiFXInstaForex Review 2026: Is This Forex Broker Safe?
WikiFXSandStoneFX Review 2026: Is This Forex Broker Safe?
WikiFXFake Investment Scam and Human Trafficking Network Busted with 109 Arrested
WikiFXForex Traders With Day Jobs: The PERKESO Deadline You Cannot Ignore
WikiFXMaxpro365 Review 2026: Where Is My $23,000? We Investigated User Allegations About Missing Funds
WikiFXHow Trading Costs Quietly Drain Your Account: Spreads, Swaps, and Pip Values
WikiFXWhy MetaTrader 4 Remains the Top Choice for Testing Automated Trading Robots
WikiFX