


India Q1 FY27 GDP Growth Hits 7.8%: 3 Scenarios for INR and Gold
India's Q1 FY27 GDP grew 7.8%, beating a 7.4% poll and RBI's 7.0% projection. See three conditional scenarios for INR, rates and gold.
Original

简体中文
繁體中文
English
Pусский
日本語
ภาษาไทย
Tiếng Việt
Bahasa Indonesia
Español
हिन्दी
Filippiiniläinen
Français
Deutsch
Português
Türkçe
한국어
العربية
اردو




Abstract:Boom and Crash are highly volatile Synthetic Indices offered solely by Deriv broker. It is the only financial instrument in the market that is not pegged against the US dollar. Boom and Crash indices are usually in four different forms as: Boom 1000, Boom 500, Crash 1000, and Crash 500. The Boom index as the name suggests refers to a sudden large spike in the market that could be as huge as 50-60 pips in the spike While the Crash Index refers to a sudden breakdown in the market prices that could be as huge as 50-60 pips. These spikes or breakdowns could occur within the one-minute timeframe chart.
By: Damian Okonkwo
What is Boom and Crash Indices?
Boom and Crash are highly volatile Synthetic Indices offered solely by Deriv broker. It is the only financial instrument in the market that is not pegged against the US dollar. Boom and Crash indices usually come in four different forms as: Boom 1000, Boom 500, Crash 1000, and Crash 500. The Boom index as the name suggests refers to a sudden large spike in the market that could be as huge as 50-60 pips in the spike While the Crash Index refers to a sudden breakdown in the market prices that could be as huge as 50-60 pips. These spikes or breakdowns could occur within the one-minute timeframe chart.

What is the meaning of synthetic Index?
Synthetic indices are twisted financial instruments that mimic the real market movement pattern but are not influenced by the fundamentals that move the market. They have their unique movement pattern solely dependent on technicals. The movement of these indices are automated and based on randomly generated numbers by a programmed third party which makes it difficult to manipulate its movement pattern.
Important Features to note about the Boom and Crash Index
The Boom and Crash Indices are very different from the rest of the forex pairs and commodities traded today. This is because they are not pegged to any currency (whether dollar or any other), hence no fundamental factors could be said to move them. Trading Boom and Crash is solely dependent on price actions and technical. Other points to note about them are:
· Strong Sudden Spike/breakdown in prices: This is an interesting feature of Boom and Crash. The Boom index is marked by a sudden spike caused by price rejection at the lower region (support) which lands it at the next resistance. This spike could cover up to 50 pips at once. The Crash index refers to a sudden downward movement or breakdown caused by price rejection at the higher region (Resistance) which lands the price at the next support or midway between the next support.
· Quick profit-making financial instruments: One of the major reasons why traders fancy this instrument is because it offers the opportunity to make quick profits within a minute in the market. Thus a spike or drop occurs within a minute with over 50-60 pips attained.
· Does not obey Stop-loss and Take Profit orders: Trading Boom and Crash indices could be very risky as it does not obey any pending Stop-loss or Take Profit orders placed in the market. Thus one can only close a given position at the end of the spike or drop.
· Lot Size: Trading Boom and Crash are very different from other forex pairs in the market as they have their guiding principles. Thus, the minimum lotsize permissible for trading Boom and Crash is 0.20 while the maximum lotsize is 50. The lot size in Boom & Crash indices has been designed in such a manner that 1 lotsize becomes equivalent to one dollar value. Hence, if your lot size is 1, then you will make or lose $1 for every one pip movement in the market. And if your lot size is 10 lots then you will make $10 for every 10pips movement in the market.
Is the Boom and Crash Indices Manipulated by the broker?
Very often, the fact that the majority of traders tend to lose while trading this pair has led to the accusations placed against the broker for manipulating these instruments against the traders. Some say that the broker that offers this pair often weighed the highest position taken by the traders and then proceeds to set the market against them.
Well, our research so far has proven this to be false. Our strongest discovery is that the Boom and Crash are programmed and largely dependent on price actions and technical dimensions.
What is the best way to make profits from trading Boom and Crash Indices?
The best way to make profits from trading Boom and Crash is to study and understand the price actions. The concept of “price actions” shows the trader how the market has reacted in the past in certain regions. This helps to project possible reactions in subsequent times when the market revisits this point. Using price action is to note support and resistance zones where the market often spiked or dropped significantly.

Disclaimer:
The views in this article only represent the author's personal views, and do not constitute investment advice on this platform. This platform does not guarantee the accuracy, completeness and timeliness of the information in the article, and will not be liable for any loss caused by the use of or reliance on the information in the article.
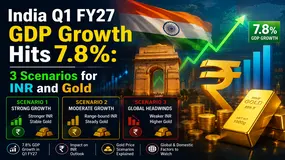
India's Q1 FY27 GDP grew 7.8%, beating a 7.4% poll and RBI's 7.0% projection. See three conditional scenarios for INR, rates and gold.

Choosing a forex liquidity provider is not a search for the lowest displayed spread or the longest provider list. It is a broker decision about pricing integrity, depth, routing, credit, reporting, incident response, and client communication. This 2026 guide explains how a forex LP, FX liquidity provider, or liquidity provider forex arrangement fits into a broker’s execution chain; what to test before onboarding; why a “best forex liquidity provider” claim cannot replace due diligence; and how to compare cost beyond commission. Use the execution-quality scorecard, provider questions, routing scenarios, and 90-day onboarding plan to assess whether a liquidity relationship can support your actual client mix, instruments, risk model, and jurisdiction. The goal is not to make a universal ranking. It is to build evidence that your broker can explain, supervise, reconcile, and recover its execution service when market conditions are difficult.
The visible fee in an MT4 white label proposal is rarely the real cost of operating it. For an existing broker, the decision is not simply whether an MT4 white label platform is “cheap” or “expensive.” The real question is whether the commercial model remains viable after integration, support, data, client migration, compliance, and exit costs are included. That is why an MT4 white label cost review should be built as a 24- to 36-month operating case. It should compare three credible choices: 1. Keep the present MT4 setup and improve its weakest controls. 2. Replace the MT4 white label provider but retain the client proposition. 3. Migrate selected clients or products to another platform while running MT4 in parallel. This guide explains how to build that case without relying on headline prices or generic vendor claims.

Artificial Intelligence (AI) has grown remarkably recently. However, it has also amplified the scope for financial fraud. One such is the rapid use of deepfake technology involving AI-generated videos, images and audio clips imitating real people. Fraudsters are leveraging these technologies to impersonate financial advisers, celebrities, business leaders and government officials to lure victims into fake investment schemes. Understanding the emerging implications, the Australian Securities and Investments Commission (ASIC) has cautioned investors of investment avenues promoted through convincing AI-generated content. Seemingly authentic, deepfakes are designed to manipulate trust and make people transfer funds before authenticating the investment’s legitimacy.
WikiFXWikiFXWikiFXWikiFXWikiFXWikiFXWikiFXWikiFXWikiFXWikiFX